

Short answer: Idaho recorded 28,127 reportable motor-vehicle crashes in 2025, the newest final year available. Those crashes included 231 fatal crashes, 8,370 injury crashes, and 19,526 property-damage-only crashes; 252 people were killed and 11,845 were injured. Compared with 2024, total crashes fell by 31 (0.1%), while fatal crashes rose by 12 (5.5%). ITD’s final 2025 report gives a statewide fatality rate of 1.22 deaths per 100 million vehicle miles traveled.
Idaho’s Final 2025 Crash Numbers
As of the September 2 review, ITD’s annual-report library ended with calendar-year 2025. The agency made that edition public on August 13, 2026. The figures below come from ITD’s Statewide Crash Database for that calendar year.
| Measure | 2025 value | What is counted | Official source |
|---|---|---|---|
| Total crashes | 28,127 | Qualifying crash records | ITD Table 1 |
| Fatal crashes | 231 | Crashes with at least one death within 30 days | ITD Table 1 and glossary |
| Injury crashes | 8,370 | Crashes classified by ITD as injury crashes | ITD Table 1 |
| Property-damage-only crashes | 19,526 | Crashes with no reported injury that met the reporting threshold | ITD Table 1 |
| People killed | 252 | People, not crashes | ITD Table 1 |
| People injured | 11,845 | People with suspected serious, suspected minor, or possible injuries | ITD Tables 1 and 3 |
| Suspected serious injuries | 1,256 | A subset of people injured | ITD Table 3 |
These measures are not interchangeable. One fatal crash can kill more than one person, and one injury crash can injure several people. ITD classifies each crash by its most severe resulting injury.
Boise, Meridian, and Nampa: 2025 Counts and Population Rates
ITD Tables 13 and 15 place Boise, Meridian, and Nampa in the same population group. Table 13 reports fatal, injury, and total crash counts. Table 15 adds people killed, people injured, 2025 city population estimates, and one specific rate: fatal plus injury crashes per 1,000 residents. That rate is not an all-crash rate and does not count injured people in its numerator.
| City | 2025 population used by ITD | Fatal crashes | Injury crashes | Total crashes | People killed | People injured | Fatal + injury crash rate per 1,000 population |
|---|---|---|---|---|---|---|---|
| Boise | 238,400 | 7 | 1,021 | 3,418 | 7 | 1,356 | 4.3 |
| Meridian | 143,000 | 9 | 921 | 2,415 | 9 | 1,347 | 6.5 |
| Nampa | 120,400 | 3 | 580 | 2,103 | 3 | 810 | 4.8 |
The published rates reproduce as follows: Boise, (7 + 1,021) / 238,400 x 1,000 = 4.3121, reported as 4.3; Meridian, (9 + 921) / 143,000 x 1,000 = 6.5035, reported as 6.5; and Nampa, (3 + 580) / 120,400 x 1,000 = 4.8422, reported as 4.8. ITD displays population in thousands to one decimal place and says those figures come from 2025 U.S. Census Bureau city estimates.
This is a transparent comparison, not a city-safety ranking. The crash records are assigned to city rows, while the rate denominator is resident population. The table does not adjust for vehicle miles, commuters, visitors, road mileage, roadway design, or traffic volume. It also cannot show an individual resident’s chance of a crash.
Do not compare these city rates numerically with the statewide rates below. The city unit is fatal and injury crashes per 1,000 residents. The statewide fatality, injury, and total-crash rates use people or crashes per 100 million vehicle miles traveled. Different numerators and denominators answer different questions.
Five-Year Idaho Crash Trend: 2021-2025
| Year | Total crashes | Fatal crashes | People killed | People injured | Fatality rate* | Injury rate* |
|---|---|---|---|---|---|---|
| 2021 | 27,549 | 246 | 273 | 12,616 | 1.41 | 65.34 |
| 2022 | 27,661 | 194 | 215 | 12,155 | 1.12 | 63.46 |
| 2023 | 27,679 | 242 | 275 | 11,859 | 1.40 | 60.26 |
| 2024 | 28,158 | 219 | 238 | 11,897 | 1.19 | 59.38 |
| 2025 | 28,127 | 231 | 252 | 11,845 | 1.22 | 57.53 |
*Rates are people killed or injured per 100 million annual vehicle miles traveled (AVMT), not percentages and not population rates.
The five-year pattern is uneven. From 2021 to 2025, total crashes increased by 578: 578 divided by 27,549 equals 2.10%. During the same period, AVMT increased by 1,281 million miles: 1,281 divided by 19,308 equals 6.63%. The fatality rate moved from 1.41 to 1.22, a decrease of 0.19 divided by 1.41, or 13.48%. These descriptive changes do not identify why the values moved.
What Changed Between 2024 and 2025?
| Measure | 2024 | 2025 | Numeric change | Calculation | Result |
|---|---|---|---|---|---|
| Total crashes | 28,158 | 28,127 | -31 | -31 / 28,158 x 100 | -0.11% (ITD rounds to -0.1%) |
| Fatal crashes | 219 | 231 | +12 | 12 / 219 x 100 | +5.48% (ITD: +5.5%) |
| People killed | 238 | 252 | +14 | 14 / 238 x 100 | +5.88% (ITD: +5.9%) |
| Injury crashes | 8,377 | 8,370 | -7 | -7 / 8,377 x 100 | -0.08% (ITD: -0.1%) |
| People injured | 11,897 | 11,845 | -52 | -52 / 11,897 x 100 | -0.44% (ITD: -0.4%) |
| Suspected serious injuries | 1,262 | 1,256 | -6 | -6 / 1,262 x 100 | -0.48% (ITD: -0.5%) |
The direction depends on the measure: overall crashes and injuries changed little, while fatal crashes and deaths increased. A statement such as “Idaho crashes went down” is therefore incomplete unless it says which outcome and year it means.
How ITD Calculates Crash, Injury, and Fatality Rates
ITD reported 20,589 million vehicle miles traveled in 2025. Using that denominator:
- Fatality rate: 252 people killed / 20,589,000,000 miles x 100,000,000 = 1.22395, reported by ITD as 1.22 fatalities per 100 million AVMT.
- Injury rate: 11,845 people injured / 20,589,000,000 miles x 100,000,000 = 57.53 injuries per 100 million AVMT.
- Total crash rate: 28,127 crashes / 20,589,000,000 miles x 100,000,000 = 136.61 crashes per 100 million AVMT, as shown in ITD Table 10.
A VMT rate adjusts for how much travel occurred. It does not show the chance that a particular driver will crash, and it should not be compared with a per-capita city rate as though the denominators were the same.
Urban Roads Had More Crashes; Rural Roads Had More Fatal Crashes
ITD counted 19,908 of 28,127 crashes on urban roads in 2025. That is 19,908 / 28,127 x 100 = 70.78%, which ITD rounds to 71%. Rural roads had 8,219 crashes, or 29.22% of the statewide total.
The severity distribution was different. Rural roads accounted for 153 of 231 fatal crashes: 153 / 231 x 100 = 66.23%, which ITD rounds to 66%. For this report, an urban roadway is within the city limits of a city with at least 5,000 people; other roads fall into the rural category. These categories describe location, not legal causation.
Urban and rural crashes moved in opposite directions in 2025
Idaho’s total reported crashes changed little from 2024 to 2025. Within that statewide total, urban crashes increased by 1,199 and rural crashes decreased by 1,230. Fatal crashes also moved in opposite directions: urban fatal crashes rose from 56 to 78, while rural fatal crashes fell from 163 to 153.
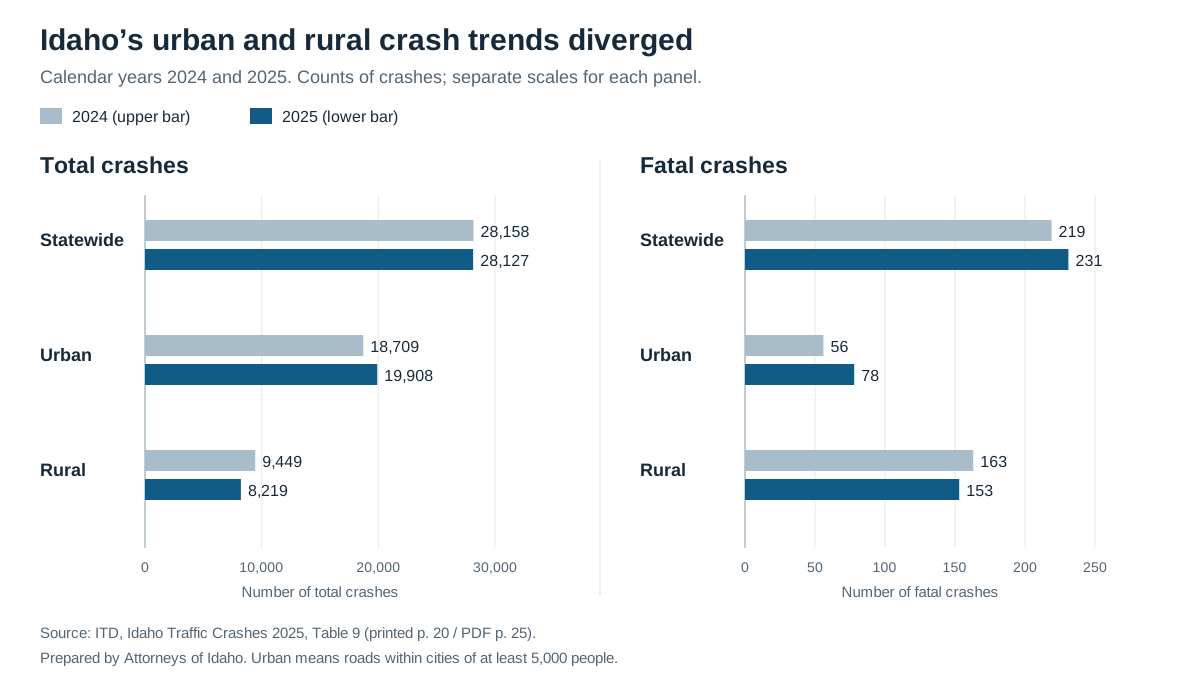
| Measure and roadway | 2024 | 2025 | Change | Change % |
|---|---|---|---|---|
| All crashes — Statewide | 28,158 | 28,127 | -31 | -0.1% |
| All crashes — Urban | 18,709 | 19,908 | +1,199 | +6.4% |
| All crashes — Rural | 9,449 | 8,219 | -1,230 | -13.0% |
| Fatal crashes — Statewide | 219 | 231 | +12 | +5.5% |
| Fatal crashes — Urban | 56 | 78 | +22 | +39.3% |
| Fatal crashes — Rural | 163 | 153 | -10 | -6.1% |
Source: Idaho Transportation Department, Idaho Traffic Crashes 2025, Table 9, printed page 20 (PDF page 25). Change = 2025 count − 2024 count. Percentage change = change ÷ 2024 count × 100, rounded to one decimal. Download the six-row comparison CSV, including source locations and calculations.
These figures count crashes, not deaths. ITD defines urban roads as roads within the city limits of cities with at least 5,000 people. The categories describe statewide roadway groups, so they do not establish a Boise-specific trend or explain why the counts changed. Counts also do not adjust for travel exposure. One year of change cannot establish a continuing trend.
What Counts in the ITD Database?
The Office of Highway Safety methodology says a vehicle crash report is completed for a motor-vehicle crash on public property when it causes an injury or death, or more than $1,500 in property damage to any one person. The annual report describes its totals as conservative because the database includes only crashes investigated by law enforcement.
ITD excludes crashes on private-property roadways, crashes that do not occur on a public roadway, and intentional acts. It also separates:
- Crash-level data: place, date, time, weather, and overall severity;
- Unit-level data: vehicles, deformity, events, and contributing circumstances; and
- Person-level data: age, injury type, and restraint use.
That structure is why “crashes,” “injury crashes,” “people injured,” “fatal crashes,” and “people killed” must remain separate.
How to Use This Statewide Reference
For interpretation of officer-recorded factors, see the separate analysis of Idaho crash contributing circumstances. Location-specific research belongs in the dedicated guides to Nampa road safety data and Meridian intersection data, rather than in a statewide ranking.
Statewide frequencies cannot establish what happened in one collision. Collision-specific analysis may require reports, photographs, video, witness accounts, roadway evidence, and vehicle data. The guide to how fault is determined in an Idaho car accident explains that separate inquiry. If you want the firm to review a specific collision, use the Idaho car-accident practice page to contact the team.
Methodology, Data Files, and Update Schedule
- Primary dataset: ITD Statewide Crash Database, calendar years 2021-2025.
- Controlling publication: Idaho Traffic Crashes 2025, released August 13, 2026.
- Calculations: Recomputed from the published numerators and denominators; additional decimal places are shown before matching ITD’s rounded display values. City rates use fatal plus injury crashes divided by ITD’s displayed 2025 Census estimate, then multiplied by 1,000.
- Companion files: A chart-ready five-year source table, a reproducible 2025 calculations table, and a Boise-Meridian-Nampa city comparison table accompany this draft for CMS upload.
- Data maintenance owner: Attorneys of Idaho content operations.
- Next scheduled publication check: August 2, 2027, then weekly until ITD posts its final 2026 annual report; update this article within 10 business days of release.
Download the Attorneys of Idaho companion files: Idaho 2021–2025 crash-statistics companion CSV, Idaho 2025 crash-statistics calculations companion CSV, and Boise–Meridian–Nampa 2025 crash comparison companion CSV. These Attorneys of Idaho research companions organize information from the cited sources; they are not official ITD datasets or raw crash records.
Sources and References
- Idaho Transportation Department, Idaho Traffic Crashes 2025 – methodology and Tables 1-3, 9-10, 13, and 15.
- Idaho Transportation Department, “Idaho releases 2025 statewide crash report,” August 13, 2026.
- Idaho Office of Highway Safety – crash-report coverage, dashboard, and annual-report library.
These statewide totals are general background, not legal advice. They cannot resolve responsibility, legal cause, recoverable loss, or any individual claim.
Legal review
Legal reviewer
Reviewed by J.W. Bond , Founding Attorney and Partner on September 2, 2026.